Category Archives: Quantitative Reasoning

GRE Solutions Manual, Problem 6.25

This page is part of my unofficial solutions manual to the GRE Paper Practice Book (2e), a free resource available on the ETS website. They publish the questions; I explain the answers. If you haven’t worked through the Practice Book, give Section 6 a shot before reading this!

6.25: Range of a List

Here we are at last: the final problem of the Paper Practice Book. If you’ve read the solutions to previous problems (specifically 5.24 and 6.2), you don’t need me to tell you that this is a rangefinding problem. That means instead of trying out each answer, we’re going to figure out the minimum and maximum values that the problem conditions allow.

This problem actually asks us for the range of the list, meaning the difference between the largest and smallest numbers in the list. The smallest number is 3.7, a constant; the largest is 2a, a variable. So our range is

But in order to figure out the minimum and maximum values of that expression, we first need to find the minimum and maximum values of 2a. We have two sources of information about the variable a in this problem:

  • itself, which is in the middle of the list
  • 2a, which comes at the end of the list

When it first appears, is between 4.1 and 8.5. Multiplying those quantities by 2 gives us

A further restriction on the value of 2comes from the end of the list, where we learn that

Combining those two inequalities allows us to set the following bounds on the value of 2a:

We’re now in a position to find the minimum and maximum range. As 2a approaches its lower limit of 9.2, the range of the list approaches its lower limit of

And as 2a approaches its upper limit of 17.0, the range of the list approaches its own upper limit of

Putting this all together, we get

which means that all of the values between 5.5 and 13.3 — answers (C), (D), and (E) — are correct answers.


Math Review Reference

For more on this topic, see the following section of the GRE Math Review:

  • 4.2: Numerical Methods for Describing Data (pp. 70-71)

GRE Solutions Manual, Problem 6.24

This page is part of my unofficial solutions manual to the GRE Paper Practice Book (2e), a free resource available on the ETS website. They publish the questions; I explain the answers. If you haven’t worked through the Practice Book, give Section 6 a shot before reading this!

6.24: Quadratics with Negative Exponents

This is another one of those “combo” problems, where the GRE tests you on two topics at once. You may recognize from the setup that this is a quadratic equation, but with a twist: the exponents are negative. Just as in 6.8 (the fraction/exponent/inequality combo problem), we can break down this seemingly messy situation into tractable steps:

  • Factor out the quadratic expression, ignoring the negative exponents for now.
  • Interpret the negative exponents to find the solutions to the equation.


Factoring the Quadratic Expression

For our factoring step, we’ll hold onto the minus signs in the exponents, but otherwise we’ll treat this like any other quadratic equation we might encounter on the GRE.

To complete the factors, we need two numbers

  • whose product is -15
  • whose sum is 2

Note that for a pair of numbers to have a product of -15, one of them must be negative and the other positive. Here are all of the integer possibilities:

  • (-1, 15)
  • (1, -15)
  • (-3, 5)
  • (3, -5)

Of these four integer pairs, only (-3, 5) sums to 2, which means that the correctly factored expression is

Thus, in terms of y-1, our two solutions are


Negative Exponents

Now we have to reckon with the other piece of the puzzle: negative exponents. There’s a simple rule for these:

A negative exponent is the reciprocal of the corresponding positive exponent.

To put it somewhat more formally:

In terms of problem 6.24, this means that

so we can rewrite our two solutions from the previous step as follows:

Solving for in each case gives us

The latter solution is on the answer list as (C).


A Note on Factoring

As usual, I’ve included a list of relevant Math Review sections below. I want to point out, however, that the Math Review doesn’t cover factoring in any real detail. Instead, they encourage you to use the quadratic formula as your default method.

The trouble with this is that, for the kinds of polynomials you’ll see on the GRE, factoring is usually the faster approach; for my money, it’s also easier to remember in the middle of a four-hour exam. For an extensive tutorial on factoring methods, along with plenty of worked examples, check out Khan Academy (look for “Factoring Polynomials – Quadratic Forms”).


Math Review Reference

For more on this topic, see the following sections of the GRE Math Review:

  • 2.2: Rules of Exponents (pp. 18-20)
  • 2.4: Solving Quadratic Equations (pp. 22-23)

GRE Solutions Manual, Problem 6.23

This page is part of my unofficial solutions manual to the GRE Paper Practice Book (2e), a free resource available on the ETS website. They publish the questions; I explain the answers. If you haven’t worked through the Practice Book, give Section 6 a shot before reading this!

6.23: Piecewise-Defined Functions

The function in this problem is what we call piecewise-defined, meaning that a different “piece” of the function comes into play depending on what value of x is specified. You can think of such a function as a tiny computer program that

  • checks to see what subdomain x belongs to.
  • performs the appropriate operation from a list of possibilities.

Here, the function accepts only integers. It isn’t defined at all for other numbers, so expressions like f(π) don’t make sense in the context of this problem. When is even, the function subtracts 1; for example, f(2) = 1. When is odd, the function adds 1, so f(3) = 4.

The expression

means that we run the function on two numbers and b (these can be different numbers, or they can be the same) and add together the results. The equation

means that the sum of the output (what comes out of the function when we run it on and b) is equal to the sum of the inputs (the and that we start out with).

Now, because the function’s behavior depends on whether x is even or odd, we have three basic possibilities in choosing our values of and b:

  • Choose two even numbers as our inputs.
  • Choose two odd numbers as our inputs.
  • Choose one even number and one odd number.

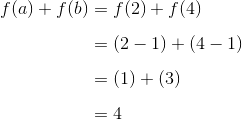
If both inputs are even (e.g., a = 2 and b = 4), the function will subtract 1 from each input:

So the sum of the output (4) is less than the sum of the input (6). We’ll get a similar inequality for any two even numbers (ab) because the function will subtract twice.

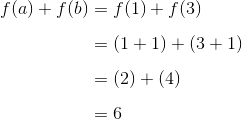
If both inputs are odd, (say, a = 1 and b = 3), then the function will add 1 to each input:

In this case, the sum of the output (6) is greater than the sum of the input (4). This will be the result any time that both and are odd.

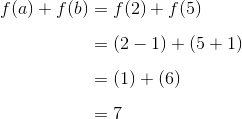
But if one input is even, and the other one is odd, then the addition and subtraction will cancel out. Let’s try = 2 and = 5:

Of the three options we’ve tried, only this one fulfills our initial condition of

Now, looking at our answer choices, we see that only one of them can be true when is even and is odd, or vice versa. We can rule out answers (A), (B), (D) and (E), because they all imply (or explicitly state) that and have the same parity (i.e., both even or both odd). That leaves correct answer (C), which not only permits the integers to have different parities, but requires it: in order for two integers to have an odd sum, one of those integers must be even and the other one odd. 


Math Review Reference

For more on this topic, see the following sections of the GRE Math Review:

  • 1.1: Integers (p. 2)
  • 2.6: Functions (pp. 24-25)
  • 2.9: Graphs of Functions (p. 37)

GRE Solutions Manual, Problem 6.22

This page is part of my unofficial solutions manual to the GRE Paper Practice Book (2e), a free resource available on the ETS website. They publish the questions; I explain the answers. If you haven’t worked through the Practice Book, give Section 6 a shot before reading this!

6.22: Standard Deviation (SD) with Bell Curve

In “Standard Deviation for the GRE,” I explained that there were two basic types of SD problems to watch out for: “compare two data sets” and “analyze a normal distribution.” This problem falls into the latter category: you’re given a standard bell curve and the mean and SD of a population, then asked to make some calculations on the basis of those figures.

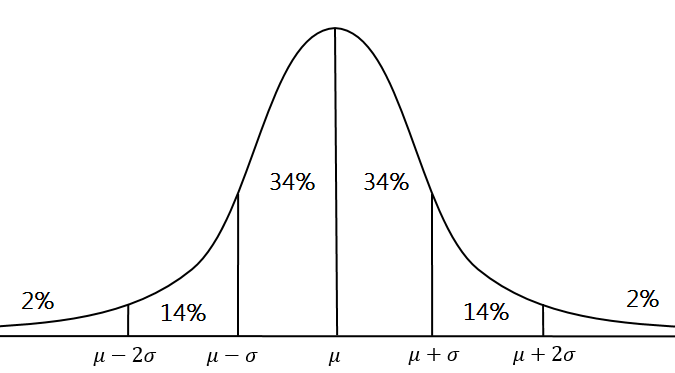
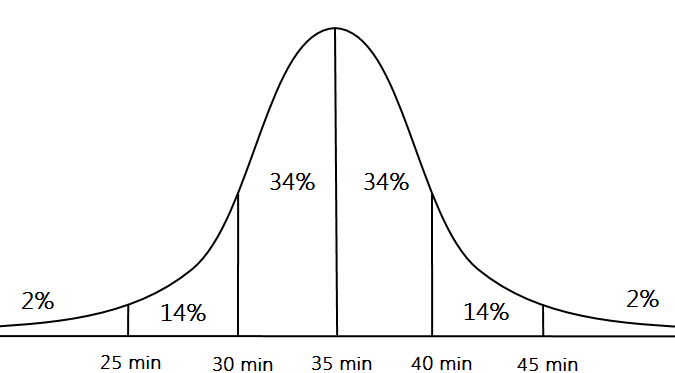
In any normal distribution — not just the standard one — the relative frequencies of events are “sliced up” into intervals as follows:

where µ (mu) is the mean and σ (sigma) is the standard deviation. The diagram in the problem is the standard normal distribution, where µ = 0 and σ = 1. But the problem itself involves a mean of 35 minutes and an SD of 5 minutes. So we have to relabel the bell curve to match that new information.

You don’t have to physically redraw the curve; listing the values like this is fine too, as long as you understand where each value belongs on the graph:

μ – 2σ μ – σ µ µ + σ µ + 2σ
25 min 30 min 35 min 40 min 45 min

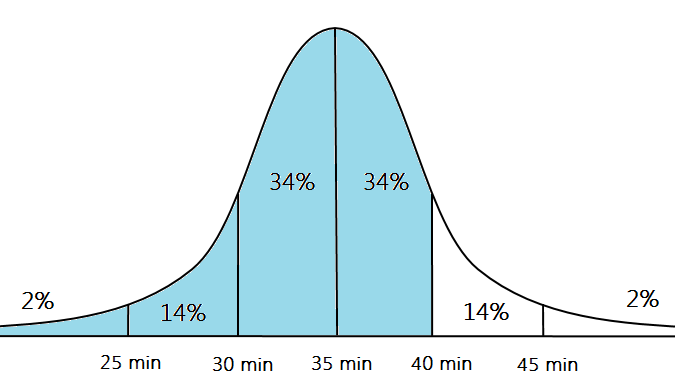
Now, “travel times less than 40 minutes” includes everything left of the 40-min mark on our bell curve.

This comprises four labeled intervals, as shown above. Adding them all up gives us

which corresponds to answer choice (E).

By the way, you don’t need to memorize the values of the percent frequencies; they’ll be provided if the problem calls for them. Note, however, that the GRE uses slightly different frequencies from the accepted “68-95-99.7” rule that you may have learned in a statistics class. This small quirk is just one more reason to read carefully any diagram you encounter on the exam.


Math Review Reference

For more on this topic, see the following section of the GRE Math Review:

  • 4.5: Distributions of Data, Random Variables, & Probability Distributions (pp. 87-89)


Credits

The three bell-curve diagrams are adapted from the work of Dan Kernler (licensed under CC BY-SA 4.0). Feel free to use, adapt, and distribute under the terms of the license.

GRE Solutions Manual, Problem 6.21

This page is part of my unofficial solutions manual to the GRE Paper Practice Book (2e), a free resource available on the ETS website. They publish the questions; I explain the answers. If you haven’t worked through the Practice Book, give Section 6 a shot before reading this!

6.21: Cube Root, Square Root

With the chart block out of the way, we’re in the home stretch. This problem basically tests your knowledge of the relationship between roots (square, cube, etc.) and exponents. Specifically, they’re checking to see if you know how to “undo” the square root and cube root operations:

Here, we apply the rules as follows:

  • Since 3 is the cube root of x, 3 cubed gives us the value of x.

  • Since x is the square root of y, x squared gives us the value of y.


Math Review Reference

For more on this topic, see the following section of the GRE Math Review:

  • 1.3: Exponents and Roots (p. 5)

GRE Solutions Manual, Problem 6.20

This page is part of my unofficial solutions manual to the GRE Paper Practice Book (2e), a free resource available on the ETS website. They publish the questions; I explain the answers. If you haven’t worked through the Practice Book, give Section 6 a shot before reading this!

6.20: State Populations, Pt. 4

Rounding out this block is a basic descriptive-statistics question. In order to find the median of a data set, we have to arrange the elements of that set in increasing order. We can’t quite do that here, because we don’t know the values of the individual elements. But that’s fine, because we don’t need to determine the median precisely. We just need to know its approximate whereabouts.

Regardless of their order within the category, the 15 least populous states will all be in category A. (In other words, if we could actually arrange the states in order of increasing population, the first 15 entries in the list would all be from category A.) The next least populous category is B, which contains 9 states. Taking these two categories together gives us 24 out of our 50 states, which is still not enough to get us to the halfway point of the list. The next 12 entries in the list (states #25 through #36 in order of increasing population) belong to category C.

Potential plot twist: when a data set has an even number of elements, there are two “middle numbers” and the median is the average of those. So the median here would be the average population of the 25th and 26th states in our list. But both of those states lie in category C, so our median must also be in category C. Conveniently, this time the category letters line up with the answer choices, so the correct answer is (C).


Math Review Reference

For more on this topic, see the following sections of the GRE Math Review:

  • 4.1: Graphical Methods for Describing Data (pp. 62-64)
  • 4.2: Numerical Methods for Describing Data (pp. 68-69)

GRE Solutions Manual, Problem 6.19

This page is part of my unofficial solutions manual to the GRE Paper Practice Book (2e), a free resource available on the ETS website. They publish the questions; I explain the answers. If you haven’t worked through the Practice Book, give Section 6 a shot before reading this!

6.19: State Populations, Pt. 3

Yet another percent-difference question! If you’re at all shaky on this concept, consider this your warning: the GRE really likes this type of problem. As I noted in problem 6.13, percent-difference scenarios can be modeled using the following equation:

This is true even if we’re comparing two different quantities, rather than tracking a change over time. Here are two examples to make sure you’re rock solid on this point. (If you’re comfortable working with percent change, feel free to skip down to the end of the post for the answer to 6.19).


Percent Change and Percent Difference

Suppose that an electronics retailer — let’s call them Best Bargain — normally sells the SwitchBox 4 game console for $300. But this week they’re running a special sale and offering the SwitchBox for $240. What percent discount does this represent? Well, the base here is our original retail price, and the change is the difference in dollars between the retail price and the sale price. So the console is

cheaper during the sale than it is normally.

Now suppose that it’s actually two stores offering the same item at different prices: Best Bargain offers it for $300, and their competitor Circuit Center sells it for $240. If we want to know the percent difference between these prices, we can still use the percent-change equation. The only catch is that we must be careful to choose the correct base. Ordinarily, in questions involving discounts or markups, the base is the original retail price. Here, however, there is no “original” price. Instead, two different questions could be asked:

  • The console is what percent less expensive at Circuit Center than at Best Bargain?
  • The console is what percent more expensive at Best Bargain than at Circuit Center?

In each case, the wording of the question tells us which quantity to use. “Less expensive” means that the higher price will be used as our point of comparison, so the higher number goes in the denominator. “More expensive” tells us that the lower price is our basis of comparison.

So for the first question (“The console is what percent less expensive at CC than at BB?”), our equation looks like this:

At a price of $240, the console is 20 percent less expensive than at $300.

For the second question (“The console is what percent more expensive at BB than at CC?”), we use the following equation:

At a price of $300, the console is 25 percent more expensive than at $240.


Back to Problem 6.19

Armed with that knowledge, we can see how to approach 6.19. The problem asks us to compare two groups of categories (“supercategories,” if you will) in terms of how many states they contain. The two supercategories contain

and

states respectively.

Here’s where the percent-change math comes in. The phrase “greater than” tells us that the base (i.e., the denominator) will be the smaller of the two numbers. In this case, that’s the number of states in the smaller supercategory (11). So the percent difference is

which corresponds to answer choice (A).


Math Review Reference

For more on this topic, see the following sections of the GRE Math Review:

  • 1.7: Percent (pp. 9-12)
  • 4.1: Graphical Methods for Describing Data (pp. 62-64)

GRE Solutions Manual, Problem 6.18

This page is part of my unofficial solutions manual to the GRE Paper Practice Book (2e), a free resource available on the ETS website. They publish the questions; I explain the answers. If you haven’t worked through the Practice Book, give Section 6 a shot before reading this!

6.18: State Populations, Pt. 2

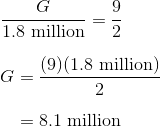
Let’s use G to denote Georgia’s population, and to denote that of West Virginia. In those terms, the problem supplies us with two pieces of information:

GRE 6.18, Eqn. 1

Plugging our value for W into the equation gives us

GRE 6.18, Eqn. 2

Because 8.0 < 8.1 < 9.9, Georgia belongs to population category E — which, somewhat confusingly, corresponds to answer choice (D).


Math Review Reference

For more on this topic, see the following sections of the GRE Math Review:

  • 1.6: Ratio (p. 9)
  • 4.1: Graphical Methods for Describing Data (pp. 62-64)

GRE Solutions Manual, Problem 6.17

This page is part of my unofficial solutions manual to the GRE Paper Practice Book (2e), a free resource available on the ETS website. They publish the questions; I explain the answers. If you haven’t worked through the Practice Book, give Section 6 a shot before reading this!

6.17: State Populations, Pt. 1

Turn the page, and we’re back to the chart block. This set of problems is a little more straightforward than those in Section 5, mainly because there’s only one data graphic to deal with. For this problem, a simple and effective approach would be to add up the “Number of States” column for each of the first five categories:

GRE 6.17, Eqn. 1

There is, however, an alternate route that some students find faster and simpler. The chart tells us (or, depending on where you’re from, reminds us) that there were 50 states in the USA during the year in question. So instead of counting up, we can start with 50 and subtract the three categories excluded by the problem:

GRE 6.17, Eqn. 2

Either way, we arrive at 43 states, which corresponds to answer choice (B).


Math Review Reference

For more on this topic, see the following section of the GRE Math Review:

  • 4.1: Graphical Methods for Describing Data (pp. 62-64)

GRE Solutions Manual, Problem 6.16

This page is part of my unofficial solutions manual to the GRE Paper Practice Book (2e), a free resource available on the ETS website. They publish the questions; I explain the answers. If you haven’t worked through the Practice Book, give Section 6 a shot before reading this!

6.16: A Slight Miscalculation

To solve this problem, we need to understand what effect Chris’s mistake had on the result of his calculation. 2,073, the factor that Chris entered into his calculator, is 1,000 times the intended factor of 2.073. So the product will be 1,000 times too large. Consequently, the correct answers will be operations that make the product smaller.

Of the four answer choices, only (A) (“multiply by 0.001”) and (D) (“divide by 1,000”) meet this criterion: either operation would cancel out the erroneous factor of 1,000. Answers (B) and (D) actually make the product even larger, amplifying the original error.


Math Review Reference

For more on this topic, see the following section of the GRE Math Review:

  • 1.5: Real Numbers (pp. 7-8)