Category Archives: Quantitative Reasoning

GRE Solutions Manual, Problem 5.10

This page is part of my unofficial solutions manual to the GRE Paper Practice Book (2e), a free resource available on the ETS website. They publish the questions; I explain the answers. If you haven’t worked through the Practice Book, give Section 5 a shot before reading this!

5.10: Workplace Demographics

This problem has a lot in common with 5.9, but it introduces a new format: Numeric Entry, or NE for short. For NE problems, you have to type in your answer — or, in the case of the paper exam, grid it in using Scantron-style bubbles. Needless to say, guessing is much less fruitful on NE than it is on other problem types: there are millions of possible combinations of digits, decimal points, and slashes, but only a few such combinations will be counted as correct.

Why are there “a few” correct answers rather than just one? The answer comes straight from the ETS, who state that “equivalent forms of the correct answer […] are all correct” (PPB2e, p. 78). In other words, you don’t need to worry about significant digits (3.00 is the same as 3.0) or lowest terms (6/8 is the same as 3/4). Be aware, however, that some NE problems will ask you to round your answer to a given place value. If you get a question that asks you to round to the nearest thousand, then an overly precise answer (3,417 rather than 3,000) may actually be marked incorrect.

The basic mathematical concepts here are the ratio and its close cousin the proportion. “The ratio of women to men is 3 to 2” just means that for every 2 men in the company, there are 3 women.

Sanity check: From the above ratio, we know that there must be fewer men than women, so our answer has to be less than 150. Common sense also tells us that the number of men at the company must be a nonnegative integer: there can’t be -12 male employees, or 0.75. If our calculations yield an answer that doesn’t fit these criteria, we know we’ve made a mistake, and it’s time to check our arithmetic.

We can rewrite the ratio as a proportion, where is the number of male employees:

3/2 equals 150/x.

Then, to solve for x, we cross multiply and simplify the result:

GRE 5.10, Eqn. 2

There are 100 male employees working at Company Y.


Math Review Reference

For more on this topic, see the following section of the GRE Math Review:

  • 1.6: Ratio (p. 9)

GRE Solutions Manual, Problem 5.9

This page is part of my unofficial solutions manual to the GRE Paper Practice Book (2e), a free resource available on the ETS website. They publish the questions; I explain the answers. If you haven’t worked through the Practice Book, give Section 5 a shot before reading this!

5.9: A Very Good Year

Probability, along with quadratic equations and standard deviation, is what I call a “scare topic” — one that students perceive as inordinately difficult, even when the underlying math is relatively simple. The test makers know this and often employ the “P-word” to add an element of suspense and intimidation to an otherwise run-of-the-mill problem.

This problem is a great example. It uses the word “probability” multiple times, but it’s actually about counting. It’s true that some of the numbers are given as probabilities, but this is a minor inconvenience, because we know the total number of people in the group. Right away, we can translate the probabilities into integers.

If there’s a 0.44 probability that a group member is male, and there are 25 group members, then there are

0.44 times 25 is 11.

males in the group. Likewise, if there’s a 0.28 probability that a group member is a “pre-1960” male (again, out of 25 total members), then there are

0.28 times 25 is 7.

“pre-1960” males in the group. Just like that, we’ve turned a probability scenario into basic arithmetic.

Next, we can draw a quick chart to help us organize this information. (This, by the way, is the sort of scratch-paper diagram that I consider useful on the GRE. It takes just a few seconds to set up and pays big dividends in clarity.)

Males Non-Males Total
Pre-1960 7
1960 or Later ???
Total 11 ??? 25

In this chart, the question marks represent values we can figure out from the information provided. The bolded question marks represent the value we need to figure out to solve the problem. Notice that we don’t have any information about the age distribution of the non-male group members.

By subtracting the “pre-1960” males from the total number of males, we find that there are 4 “1960 or later” males in the group. We can also determine that the number of non-males is 14, though we don’t need this information to solve.

MALES NON-MALES TOTAL
PRE-1960 7
1960 OR LATER 4
TOTAL 11 14 25

So the number of males in the group who were born in 1960 or later (Quantity A) is equal to 4 (Quantity B). Because the quantities are equal, answer (C) is correct.

That’s all there is to it: no “ANDs,” “ORs,” or Venn diagrams required. The moral of this story? Even if probability isn’t your strong suit, don’t assume that a problem will be difficult just because it says “probability.” There’s a good chance (ha!) that the problem will involve nothing more than accurate bookkeeping and simple arithmetic.


Math Review Reference

For more on this topic, see the following section of the GRE Math Review:

  • 4.4: Probability (pp. 78-79)

GRE Solutions Manual, Problem 5.8

This page is part of my unofficial solutions manual to the GRE Paper Practice Book (2e), a free resource available on the ETS website. They publish the questions; I explain the answers. If you haven’t worked through the Practice Book, give Section 5 a shot before reading this!

5.8: Standard Deviation (SD) with Charts

Let’s just get this out of the way:

The GRE will seldom, if ever, ask you to calculate standard deviation directly. If it looks like you have to calculate SD to solve a problem, there’s probably a faster way.

Calculating the SD for even a modestly-sized data set is a tedious and time-consuming task, even by GRE standards. For a pair of data sets with 18 elements each (which is what problem 5.8 gives us to work with), the process could easily take five minutes or more. Instead, SD problems on the GRE usually test your general, qualitative sense of how SD works — and, in particular, your ability to compare the SDs of different data sets. For a detailed guide to this, see my post “Standard Deviation for the GRE.”

When comparing the SDs of two data sets, the rule is always the same:

The data set whose elements are more widely dispersed about the mean will have the larger SD.

So which data set is “more widely dispersed” in problem 5.8? First, let’s find the mean of each distribution. Because the distributions are symmetrical, it’s fairly straightforward to show that the mean in each case is 30:

  • Pair up the 10s and 50s, which average out to 30.
  • Pair up the 20s and 40s, which also average out to 30.
  • Pair up the 30s, which (of course) average out to 30 as well.

Now, how are the values in each distribution dispersed relative to that mean? In distribution A, a third of the values (6 out of 18) are exactly equal to the mean, another third are relatively close to the mean (the 20s and the 40s), and the remaining third are far from the mean (the 10s and the 50s). Informally, we could say that A has a fairly narrow dispersion pattern.

B, in contrast, has very few values (2 out of 18) equal to the mean and lots of values (10 out of 18) at the far edges of the graph. When compared with A, the dispersion pattern of B is wide. It must therefore have the larger SD. Because Quantity B (the SD of distribution B) is larger than Quantity A (the SD of distribution A), the correct answer is (B).

Students are sometimes uncomfortable with this informal reasoning — in some cases, so much so that they would rather calculate the SD of each distribution directly, just to be sure. This is a costly tradeoff that robs minutes from the rest of the math section. Worse, the dozens of small calculations leave plenty of room for an arithmetic error; one such mistake, and the “direct” solution is no more accurate than an intuitive guess. For problems like 5.8, a broad comparison of the two data sets really is all that’s required. If that feels too much like guessing, here’s what I recommend: do it anyway. Then flag the problem for later review, and come back to it only if you finish the remainder of the section.


Math Review Reference

For more on this topic, see the following section of the GRE Math Review:

  • 4.2: Numerical Methods for Describing Data (pp. 71-73)

Standard Deviation for the GRE

Along with permutations and combinations, standard deviation (SD) is one of those GRE topics that disproportionately worry test takers. Unlike combinatorics problems, which you might not see at all on a given exam, SD problems tend to show up fairly reliably on medium- and high-difficulty math sections, at a rate of about one problem per section. There is, however, some good news: the GRE will seldom, if ever, ask you to calculate SD directly. If it looks like you have to calculate SD to solve a problem, there’s probably a faster way.

There are two types of SD problems that seem to recur in ETS materials:

  • “Answer a question about a normally-distributed population, given the population’s mean and SD.”
    • Paper Practice Book 2e: Problem 6.22
    • GRE Math Review: Exercise 4.16
  • “Compare the SD of these two data sets.”
    • Paper Practice Book 2e: Problem 5.8
    • GRE Math Review: Exercise 4.2

For the former problem type, you won’t have to know much about standard deviation at all. For the latter, you need to understand how SD works — but only in a general, qualitative way. Here’s what you need to know.


What is Standard Deviation?

Simply put, standard deviation (SD) is a measure of how widely or narrowly dispersed the elements in a data set are. Even less formally: SD measures whether a data set is “stretched apart” or “squeezed together” relative to its mean. A data set whose elements are clustered close to the mean will have a small SD; for a data set whose elements are widely dispersed, the SD will be large.

To get a sense of how SD works, it’s helpful to examine the formula used to calculate it. You almost certainly won’t need to use this formula on test day; in fact, the formula as such isn’t even included in the GRE Math Review. But working through the formula and applying it to a simple data set will allow us to see the qualitative “big picture” we need for the exam.


The Formula for Standard Deviation

Strictly speaking, the standard deviation we deal with on the GRE is the population standard deviation — the one used to measure the dispersion of an entire population rather than of a sample. (This distinction is mentioned in the Math Review (see p. 72), but I’ve never seen it tested on an official ETS question.) Here’s the formula for population standard deviation:

Formula for population standard deviation.

The lowercase sigma (σ) represents the standard deviation. Uppercase sigma (Σ) means “sum up the results of what follows,” and mu (µ) stands for the average (arithmetic mean) of the values in the data set. N is the number of values in the population.

Let’s break the process down into steps:

  1. Find the mean (µ) of the data set.
  2. For each value in the data set, find the difference between that value and the mean. Square the result and write it down.
  3. Sum (Σ) the squares from the last step.
  4. Divide the sum by N.
  5. Take the (nonnegative) square root of the result.


Calculating SD for a Small Data Set

The process is much easier to understand if we apply it to a set of actual numbers. Consider the following data set:

{1, 2, 3, 4, 5}

The mean of the values in this set is

The average of {1,2,3,4,5} is 3.

The squares of differences (step 2 above) are as follows:
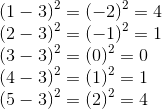
The sum of those squares (step 3) is

SD Review Eqn. 3

Dividing by N (step 4), we get

SD Review Eqn. 4

and taking the square root gives us

SD Review Eqn. 5

Looking back over our calculations, we can notice a few things:

  • Values equal to the mean make no contribution to the SD of the data set. In fact, the more such values there are, the smaller the SD will be, since will increase, butsd-review-eqn-6 will stay the same.
  • Values far from the mean make a disproportionately large contribution to the SD.
  • Calculating SD takes a while, even for small data sets. This is why we want to avoid calculating it directly whenever possible.


Comparing Standard Deviations

Notice, too, that when calculating SD, our point of reference is always the mean. The absolute magnitude of the numbers in the set doesn’t matter; only their relation to the mean does. If you try calculating the SD of

{101, 102, 103, 104, 105}

you’ll quickly see that it’s the same as the SD of our original set

{1, 2, 3, 4, 5}

The same goes for {11, 12, 13, 14, 15}, {-1, -2, -3, -4, -5}, and any other set of five consecutive integers: all such sets have a standard deviation of √2. Likewise, any set of five consecutive odd integers (e.g., {1, 3, 5, 7, 9}) or five consecutive even integers {e.g., {2, 4, 6, 8, 10}) will have a SD of 2√2. We can generalize this observation as follows:

If two data sets are identically arranged about their respective means, their standard deviations will be the same.

When the sets are not identically arranged, the more widely dispersed set will have the larger SD. On the GRE, it’s usually fairly easy to tell which data set is more widely dispersed.

  • If the sets are presented as lists, the elements of the widely-dispersed set are spaced farther apart from the mean. The dispersion may or may not be uniform.
    • The set {10, 15, 20, 25, 30} has a larger SD than {18, 19, 20, 21, 22}, because its elements are spaced more widely.
    • Likewise, the set {1, 2, 7, 12, 13} has a larger SD than {5, 6, 7, 8, 9}. Both have a mean of 7, but the elements of the former are spread farther apart from the mean.
  • If the sets are presented as graphs, the widely-dispersed set will have more elements at the edges (“wings”) and fewer elements close to the mean. See Problem 5.8 in the Paper Practice Book (2e) for an example of this.


Further Reading

To see these concepts in action, your best bet is to review the examples in the Paper Practice Book and the Math Review, which contains both practice problems and a detailed explanation of standard deviation (pp. 71-73, 87-89). Remember, though, that the Math Review is presented as a comprehensive guide to what might appear on the Quantitative Reasoning section. The fact that something’s included there (e.g., sample standard deviation) does not, by itself, make it a priority for study.

 

GRE Solutions Manual, Problem 5.7

This page is part of my unofficial solutions manual to the GRE Paper Practice Book (2e), a free resource available on the ETS website. They publish the questions; I explain the answers. If you haven’t worked through the Practice Book, give Section 5 a shot before reading this!

5.7: The Cartesian Plane

Like many coordinate-plane problems on the GRE, this question allows us to choose from multiple methods of solution. Our task, in any case, is to solve for and so that we can compare them. However, we can think of that task in at least two different ways:

  • finding the value of variables in an equation (“the algebra way”)
  • finding the coordinates of points on a line (“the geometry way”)

The wording of the problem (“xy-plane,” “points,” “line”) strongly encourages us to take the latter approach. In fact, most of my students start by sketching out x- and y- axes and plotting the line. This is not a bad approach: if you draw your graph carefully, you will be able to read off the values of and b directly. Once you get the hang of it, though, it’s much faster to solve this problem algebraically.

Finding the Value of a

The key is to translate the geometric description of a line into an algebraic description of an equation.  The problem begins with a geometric statement:

“the point (a, 0) is on the line”

The equivalent algebraic statement is this:

“The equation is true when x = a and y = 0.”

Or even more simply:

“When x = ay = 0.”

To find a, then, we take the equation and

  • replace x with 
  • replace with 0

This gives us the following:

Zero equals one-half of a, plus ten.

From there, we solve for a:

Negative ten equals one-half of a.
Negative twenty equals a.


Finding the Value of 
b

Similarly, we can translate the geometric statement

“the point (0, b) is on the line”

as an algebraic statement:

“The equation is true when x = 0 and y = b.”

Plugging in those values for x and y gives us the following:

b equals one-half of zero, plus ten.

As before, we simplify to solve for b:

b equals zero plus ten.
b equals ten.


Putting It All Together

Now that we know the values of and b, all that’s left is to compare the two: a (Qty. A) is negative, and (Qty. B) is positive, so Quantity B has to be the larger number. We select answer (B) to reflect this fact.

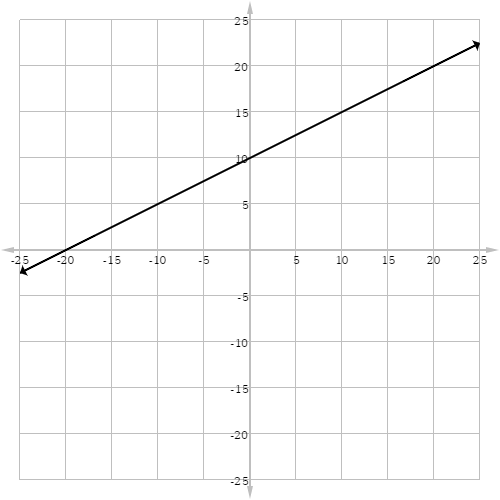
Graphing the line only serves to confirm what we found out algebraically:

Graph of "y = (1/2)x + 10."

Namely, is the x-intercept of the line, and its value is -20; b is the y-intercept, and its value is 10. On the GRE, however, sketching out a Cartesian plane should be your last resort. Drawing a graph, even a simple one, can easily add a minute to your solve time, and it doesn’t tell you anything you can’t find out using algebra. I know from experience that many students find diagrams more reassuring and intuitive than equations. To do well on the GRE math section, though, you will need to break out of this comfort zone. Diagrams have their place as a tool for for solving problems, but they are “time expensive” and shouldn’t be used to check your work.


Math Review Reference

For more on this topic, see the following sections of the GRE Math Review:

  • 2.8: Coordinate Geometry (pp. 30-36)
  • 2.9: Graphs of Functions (pp. 36-39)

GRE Solutions Manual, Problem 5.6

This page is part of my unofficial solutions manual to the GRE Paper Practice Book (2e), a free resource available on the ETS website. They publish the questions; I explain the answers. If you haven’t worked through the Practice Book, give Section 5 a shot before reading this!

5.6: Absolute Value

This problem is an excellent candidate for plugging in. It’s also a great opportunity to discuss what to plug in on Quantitative Comparison problems. When a QC problem involves variables, our goal is to figure out which relationships between the two quantities are possible, given the constraints on those variables.

Often, only one relationship is possible:

  • If quantity A is always greater, we choose answer A.
  • If quantity B is always greater, we choose answer B.
  • If the two quantities are always equal, we choose answer C.

Sometimes, however, the relationship varies depending on the numbers we choose:

  • If quantity A is sometimes greater, but sometimes quantity B is greater, we choose answer D.
  • If quantities A and B are sometimes equal, and sometimes not, we choose answer D.

Plugging in is our way of figuring out whether the relationship between the quantities is fixed (answer A, B, or C) or not (answer D). To do this, we plug in multiple different sets of numbers, solve for the two quantities, and note the relationship that results.

But we don’t just plug in numbers at random. Instead, it helps to try out numbers that have special properties:

  • Zero. Multiplying anything by 0 gives a result of 0. Adding 0 to anything leaves the sum unchanged.
  • One. Multiplying anything by 1 leaves the product unchanged.
  • Negative numbers. These are useful in problems that involve absolute value (like the one on this page!) or exponents.
  • Extremely large and small numbers. These are especially helpful in problems involving fractions: when the denominator is small, the fraction is large, and vice versa.

You can think of these four types of numbers as being “in the ZONE,” and in fact, I recommend trying them out in that order. 0 and 1 in particular are such useful plug-ins that the problem will sometimes rule them out preemptively, using phrases like “x is a positive number” or “y > 1″.

Side note: every test prep company seems to have their own magic list of numbers to try. The Princeton Review textbooks, for example, promote a somewhat longer list, which they call the FROZEN numbers. (Their “extra” numbers include Fractions and Repeats.) In my experience, this is overkill, for a couple of reasons. Plugging in fractions makes calculations unnecessarily difficult: “1/2” is much harder to manipulate on the GRE calculator than “0.5”. For “repeats,” as for pairs of different numbers, it makes the most sense to start with 0 and 1, which are already on our list.

Now, back to problem 5.6. We’re told up front that x > y, so we have to pick two different numbers for and y. Keeping our ZONE list in mind, let’s try setting x = 1, y = 0.


Plug-In Attempt #1

Let x = 1 and y = 0. Then

When x = 1 and y = 0, quantity A = 1.
When x = 1 and y = 0, quantity B = 1.

So in this case, the two quantities are equal. At this point, we’re left with two options:

  • Quantities A and B are always equal. (If so, we choose answer C.)
  • Quantities A and B are sometimes equal, sometimes not. (If so, we choose D.)

In order to figure out what’s going on, we need more information, which means we need to plug in another set of numbers and see if the A/B relationship changes.


Plug-In Attempt #2

Now, let x = 1 and y = -1. Then

When x = 1 and y = -1, quantity A = 0.
When x = 1 and y = -1, quantity B = 2.

This time, quantity B is greater. This means that depending on the values of and y, the relationship between quantities A and B can change. The corresponding answer choice is (D), which stands for “Depends on the variables” or “Don’t know.”

We’ll get lots more plug-in practice in subsequent problems.


Math Review Reference

For more on this topic, see the following section of the GRE Math Review:

  • 1.5: Real Numbers (p. 8)

GRE Solutions Manual, Problem 5.5

This page is part of my unofficial solutions manual to the GRE Paper Practice Book (2e), a free resource available on the ETS website. They publish the questions; I explain the answers. If you haven’t worked through the Practice Book, give Section 5 a shot before reading this!

5.5: Inequalities, Part 1

This problem is a fairly straightforward check on your knowledge of inequalities. (For a more advanced problem on the same theme, see 5.15.) Just like an equation, an inequality can be manipulated via addition, subtraction, multiplication, or division — as long as you apply the same operation to both sides. There’s one important difference, however:

When you multiply (or divide) both sides of an inequality by a negative number, you have to flip the signs.

Equivalently, we could say that when you multiply both sides of an inequality by a negative number, the direction of the inequality changes. For example, the statement

Three is less than five.

means that 3 is to the left of 5 on the number line. But if we multiply both sides by -1, we get:

The quantity "negative 1 times 3" is greater than the quantity "negative 1 times 5."
Negative three is greater than negative five.

On the number line, -3 is to the right of -5.

Now let’s turn back to problem 5.5. We need to find out whether t is greater than 0, equal to 0, less than 0, or whether this relationship changes for different values of t. The clue is in that other variable, r.

Looking at the leftmost term of the inequality, we can see that the product rt is negative. This tells us two things:

  • Neither nor can be zero, since then the product would be zero. (This lets us rule out answer C.)
  • Either or t, but not both, must be negative. (If both were negative, their product would be positive.)

Fortunately, we get some additional information about r in the third term of the inequality:

Zero is less than negative r.

If -r is positive, then r itself must be negative. This means that t cannot be negative, and we already determined that t can’t be zero. So t must be positive: quantity A (t) is greater than quantity B (0), and the correct answer is (A).


Math Review Reference

For more on this topic, see the following section of the GRE Math Review:

  • 1.5: Real Numbers (pp. 7-8)

GRE Solutions Manual, Problem 5.2

This page is part of my unofficial solutions manual to the GRE Paper Practice Book (2e), a free resource available on the ETS website. They publish the questions; I explain the answers. If you haven’t worked through the Practice Book, give Section 5 a shot before reading this!

5.2: Repeating Decimals

In order to see which of these two quantities is greater, we can expand the two decimals by a few place values:

0.717 repeating, expanded to six digits, is 0.717717.
0.71 repeating, expanded to six digits, is 0.717171.

These quantities are the same down to the thousandths place (the third place value after the decimal point), but they differ at the ten-thousandths place, which is underlined in the above equations. Specifically, Quantity A has a greater ten-thousandths digit than quantity B. Because this is the most significant digit in which the quantities differ, quantity A must be greater (answer A).


Math Review Reference

For more on this topic, see the following section of the GRE Math Review:

  • 1.4: Decimals (p. 6)

GRE Solutions Manual, Problem 5.1

This page is part of my unofficial solutions manual to the GRE Paper Practice Book (2e), a free resource available on the ETS website. They publish the questions; I explain the answers. If you haven’t worked through the Practice Book, give Section 5 a shot before reading this!

5.1: Transversals and Triangles

Depending on how much you like geometry, this first problem could be nerve-wracking or reassuring. Triangles are hands-down the GRE’s most favorite shape, so it behooves you to get comfortable with them if you aren’t already. There are at least two approaches we can use to solve this one.


Method 1: Transversals

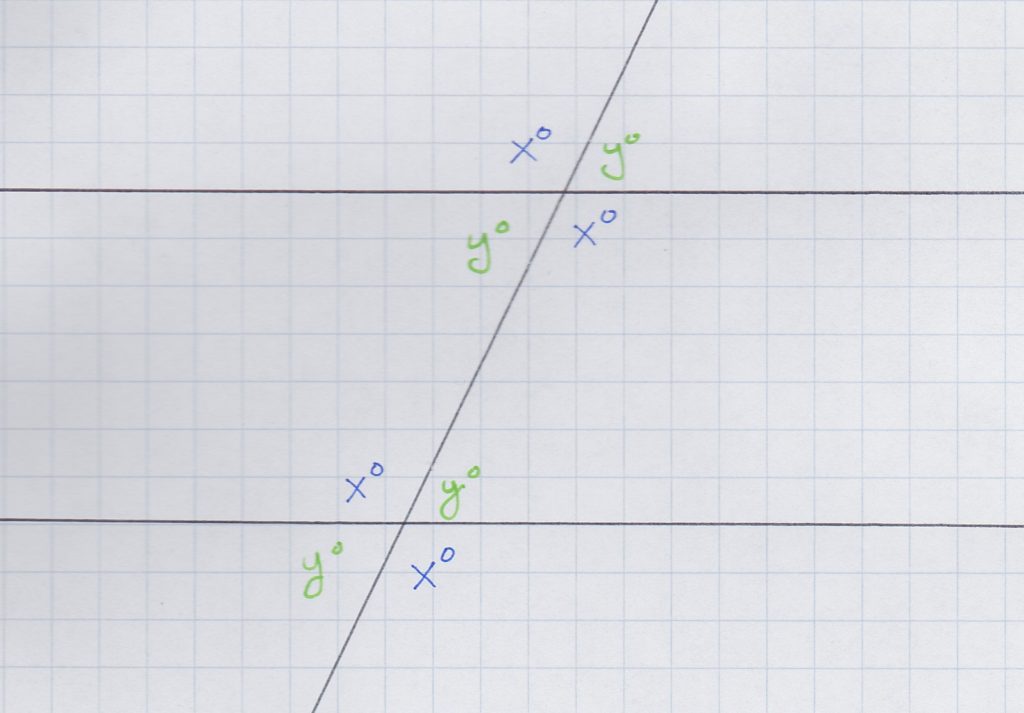
The key to this method is that and m are parallel. When two parallel lines are intersected by a third line, we wind up with a situation called a transversal of parallel lines. This arrangement has a special property that will help us out: corresponding angles are congruent. This means that for every angle at a given intersection, there is a congruent angle in the corresponding position at the other intersection. Think of it in terms of streets: the “northwest” corner of each intersection is the same. The “southwest” corners also match, and so forth.

Add to this the fact that vertical angles are congruent (this is true for any intersection of two lines), and you get the following:

A transversal of parallel lines forms two intersections.

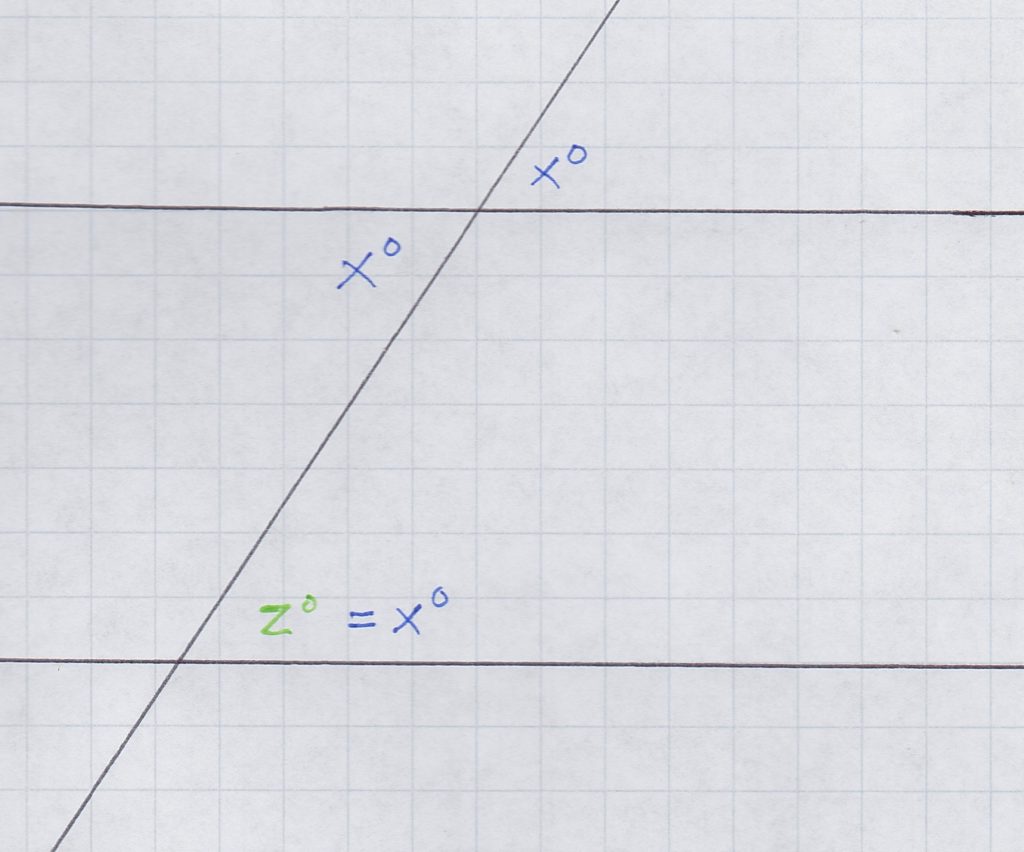
But how does this fit into the diagram from the problem? Well, let’s forget about angles and w for a moment and just focus on angles x and z. Imagine extending the left leg of the triangle upward so that it crosses line k, and downward so that it crosses line m. What do we get? A transversal of parallel lines.  The angle that is vertical to x must be congruent to x, and that angle corresponds to z, so all three of these angles must be congruent:

In this transversal, vertical angles and corresponding angles are congruent.

So we’ve shown that x = z. Using the same process, we can also show that angles y and w are congruent. If x = z and y = w, then

x + y = z + w

and the two quantities are equal (answer C).


Method 2: Triangles

The other route of solution depends on that middle angle between x and y. Let’s call it angle t. We know that x + y + t forms a straight angle, which is 180 degrees:

x + y + t = 180

But t is also an interior angle of a triangle, together with angles z and w. These three must also add up to 180:

z + w + t = 180

Because equality is transitive, we can combine the two previous equations to get the following:

x + y + t = z + w + t

Then we subtract t out from both sides to find that

x + y = z + w

which, reassuringly, is the same answer we got with the first method.


Why Two Solutions?

You may wonder why I’m bothering to show multiple methods of solution, when you only need to get the problem right once. With GRE math, it’s always a good idea to have more than one way to solve a problem, in case they surprise you with a variation where one solution method works but the other one doesn’t. In this problem, for example, what if lines k and m weren’t parallel? Method 1 (transversals) wouldn’t work anymore, but Method 2 (triangles) would work just fine.


Math Review Reference

For more on these topics, see the following sections of the GRE Math Review:

  • 3.1: Lines and Angles (pp. 45-46)
  • 3.3: Triangles (p. 47)