This page is part of my unofficial solutions manual to the GRE Paper Practice Book (2e), a free resource available on the ETS website. They publish the questions; I explain the answers. If you haven’t worked through the Practice Book, give Section 5 a shot before reading this!
5.20: You Need Both to Reach the Arrow
At long last, we come to a problem in which both charts are required. Specifically, we need to reason our way from Germany’s total tax revenue (mentioned in the pie chart) to Germany’s total retail gasoline sales (mentioned in the bar graph). The bridge between the two is Germany’s gas tax revenue, which appears in both charts.
First, let’s figure out the dollar amount of Germany’s gas tax revenue, using the pie chart. We know that the gas tax accounts for 20.4% of the total tax revenue, and we know that the total tax revenue is $170 billion. Combining those two, we get
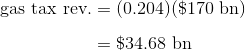
Because the answer is expressed in billions, there’s no benefit to writing out the $170 billion longhand.
Sanity check: Before we move on, notice that the gas tax revenue has to be less than the total retail gasoline sales. This means that our answer (Germany’s total retail gasoline sales) has to be greater than $34.68 billion. We can rule out (A), (B), and (C) without calculating the total retail gasoline sales directly.
To finish the calculation, we go to the bar chart, where we find that Germany’s gas tax revenue is 70.7% of its total retail gasoline sales. That fact, combined with our previous calculation of the gas tax revenue in dollars, is enough to give us a figure for total sales:
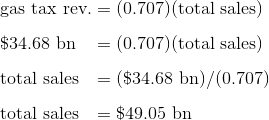
Of the answers provided, the closest approximation to total sales is $50 billion, making (E) the correct answer choice.
Math Review Reference
For more on this topic, see the following section of the GRE Math Review:
- 4.1: Graphical Methods for Describing Data (pp. 62-65)