This page is part of my unofficial solutions manual to the GRE Paper Practice Book (2e), a free resource available on the ETS website. They publish the questions; I explain the answers. If you haven’t worked through the Practice Book, give Section 6 a shot before reading this!
6.22: Standard Deviation (SD) with Bell Curve
In “Standard Deviation for the GRE,” I explained that there were two basic types of SD problems to watch out for: “compare two data sets” and “analyze a normal distribution.” This problem falls into the latter category: you’re given a standard bell curve and the mean and SD of a population, then asked to make some calculations on the basis of those figures.
In any normal distribution — not just the standard one — the relative frequencies of events are “sliced up” into intervals as follows:
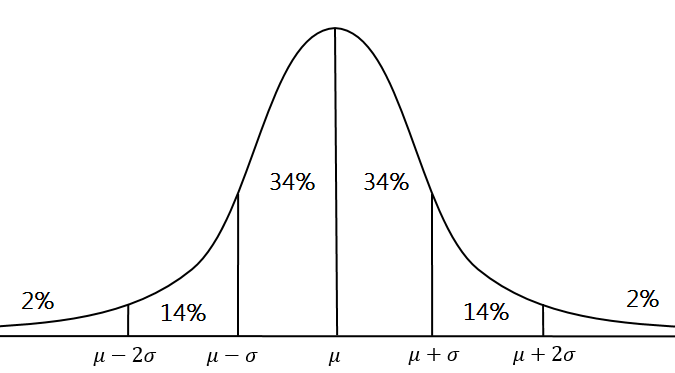
where µ (mu) is the mean and σ (sigma) is the standard deviation. The diagram in the problem is the standard normal distribution, where µ = 0 and σ = 1. But the problem itself involves a mean of 35 minutes and an SD of 5 minutes. So we have to relabel the bell curve to match that new information.
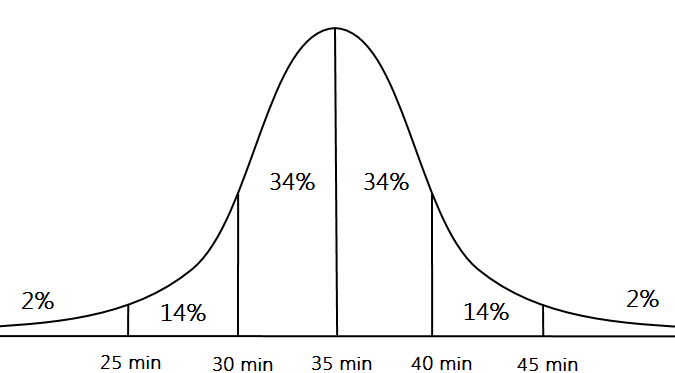
You don’t have to physically redraw the curve; listing the values like this is fine too, as long as you understand where each value belongs on the graph:
| μ – 2σ | μ – σ | µ | µ + σ | µ + 2σ |
| 25 min | 30 min | 35 min | 40 min | 45 min |
Now, “travel times less than 40 minutes” includes everything left of the 40-min mark on our bell curve.
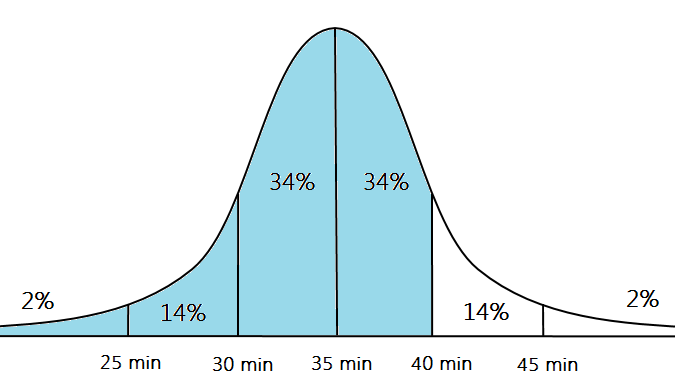
This comprises four labeled intervals, as shown above. Adding them all up gives us
![]()
which corresponds to answer choice (E).
By the way, you don’t need to memorize the values of the percent frequencies; they’ll be provided if the problem calls for them. Note, however, that the GRE uses slightly different frequencies from the accepted “68-95-99.7” rule that you may have learned in a statistics class. This small quirk is just one more reason to read carefully any diagram you encounter on the exam.
Math Review Reference
For more on this topic, see the following section of the GRE Math Review:
- 4.5: Distributions of Data, Random Variables, & Probability Distributions (pp. 87-89)
Credits
The three bell-curve diagrams are adapted from the work of Dan Kernler (licensed under CC BY-SA 4.0). Feel free to use, adapt, and distribute under the terms of the license.