Along with permutations and combinations, standard deviation (SD) is one of those GRE topics that disproportionately worry test takers. Unlike combinatorics problems, which you might not see at all on a given exam, SD problems tend to show up fairly reliably on medium- and high-difficulty math sections, at a rate of about one problem per section. There is, however, some good news: the GRE will seldom, if ever, ask you to calculate SD directly. If it looks like you have to calculate SD to solve a problem, there’s probably a faster way.
There are two types of SD problems that seem to recur in ETS materials:
- “Answer a question about a normally-distributed population, given the population’s mean and SD.”
- Paper Practice Book 2e: Problem 6.22
- GRE Math Review: Exercise 4.16
- “Compare the SD of these two data sets.”
- Paper Practice Book 2e: Problem 5.8
- GRE Math Review: Exercise 4.2
For the former problem type, you won’t have to know much about standard deviation at all. For the latter, you need to understand how SD works — but only in a general, qualitative way. Here’s what you need to know.
What is Standard Deviation?
Simply put, standard deviation (SD) is a measure of how widely or narrowly dispersed the elements in a data set are. Even less formally: SD measures whether a data set is “stretched apart” or “squeezed together” relative to its mean. A data set whose elements are clustered close to the mean will have a small SD; for a data set whose elements are widely dispersed, the SD will be large.
To get a sense of how SD works, it’s helpful to examine the formula used to calculate it. You almost certainly won’t need to use this formula on test day; in fact, the formula as such isn’t even included in the GRE Math Review. But working through the formula and applying it to a simple data set will allow us to see the qualitative “big picture” we need for the exam.
The Formula for Standard Deviation
Strictly speaking, the standard deviation we deal with on the GRE is the population standard deviation — the one used to measure the dispersion of an entire population rather than of a sample. (This distinction is mentioned in the Math Review (see p. 72), but I’ve never seen it tested on an official ETS question.) Here’s the formula for population standard deviation:
![]()
The lowercase sigma (σ) represents the standard deviation. Uppercase sigma (Σ) means “sum up the results of what follows,” and mu (µ) stands for the average (arithmetic mean) of the values in the data set. N is the number of values in the population.
Let’s break the process down into steps:
- Find the mean (µ) of the data set.
- For each value in the data set, find the difference between that value and the mean. Square the result and write it down.
- Sum (Σ) the squares from the last step.
- Divide the sum by N.
- Take the (nonnegative) square root of the result.
Calculating SD for a Small Data Set
The process is much easier to understand if we apply it to a set of actual numbers. Consider the following data set:
{1, 2, 3, 4, 5}
The mean of the values in this set is
![]()
The squares of differences (step 2 above) are as follows:
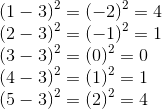
The sum of those squares (step 3) is
![]()
Dividing by N (step 4), we get
![]()
and taking the square root gives us
![]()
Looking back over our calculations, we can notice a few things:
- Values equal to the mean make no contribution to the SD of the data set. In fact, the more such values there are, the smaller the SD will be, since N will increase, but
 will stay the same.
 - Values far from the mean make a disproportionately large contribution to the SD.
- Calculating SD takes a while, even for small data sets. This is why we want to avoid calculating it directly whenever possible.
Comparing Standard Deviations
Notice, too, that when calculating SD, our point of reference is always the mean. The absolute magnitude of the numbers in the set doesn’t matter; only their relation to the mean does. If you try calculating the SD of
{101, 102, 103, 104, 105}
you’ll quickly see that it’s the same as the SD of our original set
{1, 2, 3, 4, 5}
The same goes for {11, 12, 13, 14, 15}, {-1, -2, -3, -4, -5}, and any other set of five consecutive integers: all such sets have a standard deviation of √2. Likewise, any set of five consecutive odd integers (e.g., {1, 3, 5, 7, 9}) or five consecutive even integers {e.g., {2, 4, 6, 8, 10}) will have a SD of 2√2. We can generalize this observation as follows:
If two data sets are identically arranged about their respective means, their standard deviations will be the same.
When the sets are not identically arranged, the more widely dispersed set will have the larger SD. On the GRE, it’s usually fairly easy to tell which data set is more widely dispersed.
- If the sets are presented as lists, the elements of the widely-dispersed set are spaced farther apart from the mean. The dispersion may or may not be uniform.
- The set {10, 15, 20, 25, 30} has a larger SD than {18, 19, 20, 21, 22}, because its elements are spaced more widely.
- Likewise, the set {1, 2, 7, 12, 13} has a larger SD than {5, 6, 7, 8, 9}. Both have a mean of 7, but the elements of the former are spread farther apart from the mean.
- If the sets are presented as graphs, the widely-dispersed set will have more elements at the edges (“wings”) and fewer elements close to the mean. See Problem 5.8 in the Paper Practice Book (2e) for an example of this.
Further Reading
To see these concepts in action, your best bet is to review the examples in the Paper Practice Book and the Math Review, which contains both practice problems and a detailed explanation of standard deviation (pp. 71-73, 87-89). Remember, though, that the Math Review is presented as a comprehensive guide to what might appear on the Quantitative Reasoning section. The fact that something’s included there (e.g., sample standard deviation) does not, by itself, make it a priority for study.